Screenshots
Please note: the User Guide has many more images of SOFA Statistics in use.
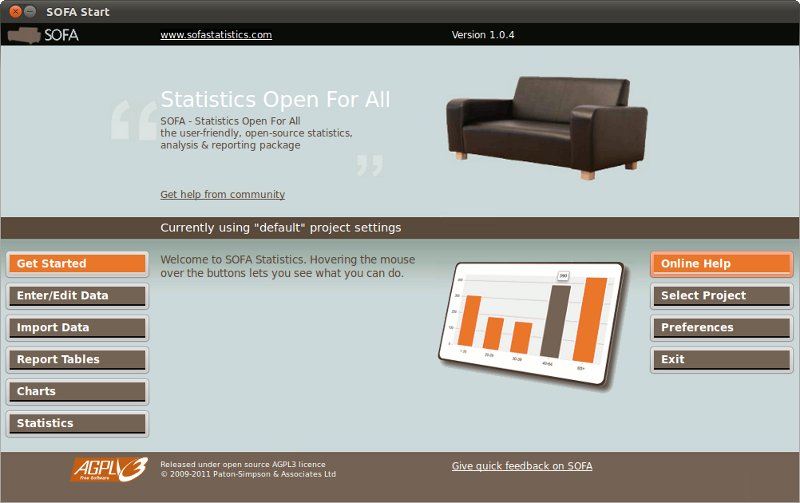
Start Menu
Everything can be done from the same start screen.

Making Attractive Charts
SOFA Statistics generates attractive, and dynamic, charts that you can share with others easily. The output is HTML and Javascript so it is web-friendly from the start.

Selecting a Statistical Test
SOFA Statistics helps you choose the correct test but also makes it easy for you to work quickly if you already know which one you need.

Project configuration
Projects are entirely optional but they make it easy to keep all your settings (labels, data sources etc) together. And you can easily switch from one project to another.

Data Editing
Data can be viewed or edited and new records can be added - irrespective of which database the data is stored in e.g. MySQL, SQLite, MS Access etc. Very large datasets can be displayed.

Making a Table
All your tables can be made from the same dialog. You can easily change your mind or experiment until you get the exact table you want.
Simple Frequency Tables

While interacting with the data you can see a demonstration table changing in sync with your changes. This makes it easier to design the table before running it.
Complex Nested Tables
Complex nested tables can be made easily. These use the labels you select and can be styled with simple style sheets. The output can be directly pasted into a spreadsheet.

Simple Display Tables

Works on Multiple Systems

SOFA will run on Windows (XP, Vista, and Windows 7), Apple Mac (OS X Leopard and Snow Leopard), and Ubuntu Linux (and Linux Mint).

Design Credits
The look and feel of the website was created by David Organ, winner of a design competition held at Natcoll Auckland.

